

Debugging used to involve finding errors in code, but now it consists of understanding the actions of apps that rely on data and AI. Historical debugging tools built for linear code are ineffective with systems that run on probabilities, black-box AI and variable data. Nowadays, logs, traces, metrics and event streams play a key role in exposing what happens in the system, just like source code did before. Today, developers depend on logs, traces, metrics and event streams instead of reading program logic to understand what happens in the system. This new approach means teams need to update their methods for investigating and resolving software problems, particularly in machine learning.
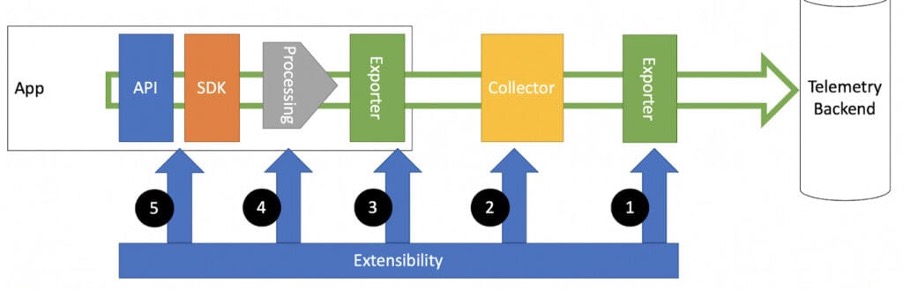
Figure 1. Telemetry architecture. The components of OpenTelemetry include automatic instrumentation and contribution packages, cross-language specification, per-language SDKs, and tools for gathering, converting and exporting telemetry data. Vendor-specific SDKs and tools can be substituted with the components that are offered.
Traditional Debugging Meets its Limits
Historically, debugging meant looking at the source code to find the root of problems. You had to find the malfunctioning part of the code, read what happened just before and trace the mistake to its source — instead, the way machine apps and not fixed tools define these systems work. AI systems do not rely on source code like older systems do. Things are learned from data, and statistical models decide the outcome. In AI-driven systems, what appears to be a bug may be caused by data or the model instead of the source code. If an AI system makes a wrong prediction, it might be due to data drift, concept changes, or problems with the model, not an error in the code.
In this case, debugging is usually difficult because the reasons for an error are hard to find. What triggered the anomaly? Could it be a result of an input batch that changed things? A shifted feature distribution? An updated model? Telemetry is the only way to learn about runtime behaviors and the settings systems experience. Telemetry lets you monitor and fix issues by looking closely at the output data, usage rates and each step the system took.
Telemetry has shifted from being passive to taking on more active functions now. As such, telemetry helps developers monitor, fix issues and check how the system performs. By analyzing telemetry, developers can study the system’s inputs and decisions and how it reaches these decisions in AI-driven systems, where the system’s behavior isn’t set in advance.
Designing Telemetry Like You Design Code
For this evolution to happen, telemetry must receive the same attention as any other code. In the same way developers ensure their code is easy to use and debug, they should also make their observability signals easy to review and interpret. When telemetry is not well-connected, there is a lack of clarity, and key information can disappear. In other words, well-instrumented systems produce data that is organized and easy to follow.
Telemetry integration should happen throughout every stage of the system’s life, including data consumption, building models and using the results. Some good telemetry signals include changes in data structures, statistics on features, version info, confidence rates from predictions, records of user interactions and system performance. If designed correctly, this data makes it much simpler to trace and fix bugs in the system.
It is also very important for telemetry to work across services and domains. AI-native systems use various services, including data pipelines, microservices, containers and third-party APIs. All telemetry should be linked to see the complete picture of what’s going wrong in the system. Ensuring AI systems work well means using observability systems that trace and connect data from many services and domains.
It is essential to debug AI systems as they run in real conditions. In real-life situations, AI-related problems can show up as issues with performance, slow responses, and out-of-sync feedback systems. Telemetry should now be captured in real-life conditions, as most AI-related issues develop only in production. Real-time alerts and looking back at problems require live and quick data from AI systems.
Debugging as a Telemetry-Driven Discipline
With telemetry now being the primary tool for fixing issues, how engineering works has shifted. When someone is debugging, they read telemetry to see what is being reported, get a sense of what is missing in the logs and metrics and make adjustments to make the instrumentation stronger in the future. How effective the telemetry is helps define how fast and successful the response to an incident is.
AI is also helping to advance telemetry. Using machine learning, observability platforms are better equipped to discover anomalies, group similar events, and suggest what may be the root of the issue. This intelligence layer supports teams by turning raw signs into narratives that can be acted on.
However, everything depends on people changing their views. It is equally crucial for engineering teams to focus on writing good telemetry as writing good code. Reviewing observability, covering all telemetry tests and setting common standards should be a regular part of everyone’s work. You should ensure your instrumentation is well laid out, that all names are consistent and meaningful and that everyone on the team understands each signal.
In AI-native systems, a system’s actions are influenced by data, context and interactions with things outside the code. Code details the plans, while telemetry gives us the details of the actual deployment. If we want to improve and trust any of these systems, telemetry must be considered the new primary source of truth. The debugging approach is changing. Telemetry is at the core of everything, making data clear, up-to-date, meaningful and valuable.